In the dynamic landscape of business and innovation, a brilliant idea is merely the first step. To truly thrive and make a tangible impact, it is not enough to know what you offer; you must precisely understand the scale of your opportunity. This is where market sizing becomes indispensable: a critical exercise that illuminates the playing field and helps you avoid the costly pitfalls of misdirection. For anyone navigating the complexities of market potential, from aspiring entrepreneurs to seasoned strategists, a clear grasp of Total Addressable Market (TAM), Serviceable Addressable Market (SAM), and Serviceable Obtainable Market (SOM) is absolutely essential. These are not just buzzwords; they are the foundational metrics that dictate strategic focus, resource allocation, and ultimately, the viability of any venture. Let’s delve into these important concepts and uncover how to use them effectively to build a robust and enduring path forward.
Total Addressable Market (TAM)
What it is: At its core, Total Addressable Market (TAM) represents the total market demand, all potential revenue, for a product or service if 100% market share were achieved. Imagine a world where your solution is the only one available, and everyone who could possibly use it, does. That is your TAM.
Why it matters: It is the grand vision, the ultimate revenue ceiling for your offering. While it is a theoretical maximum, TAM is a key indicator for investors. They use it to gauge the sheer scale of the opportunity and ensure there is enough room for exponential growth, typically looking for markets with a minimum of a billion-dollar potential.
Between TAM, SAM, and SOM, TAM is probably the most critical market size and consequently we will discuss extensively how it is going to be calculated later in this post.
Serviceable Addressable Market (SAM)
What it is: SAM (sometimes also called Serviceable Available Market) is the portion of your Total Addressable Market (TAM) that your company can realistically reach and serve with its current business model, product offerings, and distribution channels.
Think of it this way: If TAM is the entire ocean of fish, SAM is the school of fish that your specific fishing boat (your business) is equipped to pursue and catch within that ocean.
Key considerations for defining SAM:
- Geographic Reach: Your SAM is limited to the regions where your product is actually available due to distribution, regulations, or language barriers.
- Customer Segments & Demographics: Your product might only appeal to specific age groups, industries, or business sizes. SAM filters TAM based on these precise customer profiles.
- Product Capabilities & Fit: Does your product genuinely address the needs of everyone in the TAM? SAM focuses on the segments that your product is designed and capable of serving (e.g., high-end enterprise software won’t have small businesses in its SAM).
- Business Model Limitations: Your operational model might naturally exclude certain market segments (e.g., a subscription-only service won’t target customers looking for one-time purchases).

How it’s calculated: SAM is a direct subset of TAM. You start with your refined TAM calculation and then apply filters based on these realistic operational constraints.
SAM = (Relevant segment of TAM) × (Your Price per customer/unit)
Serviceable Obtainable Market (SOM)
What it is: SOM (also known as Share of Market) is the most realistic and conservative estimate. It’s the portion of the Serviceable Addressable Market (SAM) that your company can realistically capture or “win” in the short to medium term, given its specific resources, current capabilities, competitive landscape, and marketing efforts.
SOM represents the actual number of fish you are genuinely likely to catch from the school of fish (SAM) in the near future, considering your crew’s skill, net size, and other boats fishing nearby. This is your most actionable market projection.
Key considerations for defining SOM:
- Competitive Landscape: Crucially, who are your direct and indirect competitors? How strong are they? What market share do they currently command? Your SOM must account for the existing competition.
- Company Resources & Constraints: This includes your marketing budget, sales team size, production capacity, brand recognition, and distribution network. A brand new startup will naturally have a much smaller SOM than an established market leader.
- Go-to-Market Strategy: Your specific plans for reaching and converting customers (e.g., direct sales, online advertising, partnerships, content marketing) will dictate how much of the SAM you can realistically obtain.
- Historical Performance (if applicable): If you have existing sales data, your past market penetration within your SAM can inform your SOM. For new businesses, this might be a small, realistic percentage (e.g., 1-5%) based on industry benchmarks and your unique competitive advantage.

How it’s calculated: SOM is a subset of SAM, typically estimated as a realistic percentage of the SAM.
SOM = (Realistic percentage of SAM) × SAM
SAM vs. SOM: Understanding the Critical Difference
The distinction between SAM and SOM is frequently blurred, leading to unrealistic short-term projections and misaligned expectations. While SAM defines what your company can realistically serve based on its product, business model, and distribution, SOM focuses on what it can realistically capture given internal limitations and external competition. SAM outlines the accessible market segment your current solution is equipped to pursue, whereas SOM considers the competitive friction and your actual execution capabilities. Investors examine SAM to understand the near-term growth potential of a specific solution, but they scrutinize SOM to understand operational realism and go-to-market effectiveness. An overly optimistic SOM, particularly for a new venture, signals naiveté, while a realistic SOM demonstrates a grounded understanding of the competitive landscape and a clear, executable plan.
The Concentric Circles: TAM, SAM, and SOM in Harmony
Think of these three market sizing metrics as concentric circles, each offering a progressively narrower and more realistic view of your market opportunity:
| Metric | Definition | Purpose/Focus | Calculation Basis |
| Total Addressable Market (TAM) | The total market demand for a product or service if 100% market share were achieved. | Represents the ultimate revenue ceiling; sets the grand vision. | Number of Target Customers × Your Price (bottom-up approach). |
| Serviceable Addressable Market (SAM) | The portion of TAM that your company can realistically reach and serve with its current business model, product, and distribution. | Defines the accessible market segment your current solution is equipped to pursue. | Relevant segment of TAM × Your Price (filters applied to TAM). |
| Serviceable Obtainable Market (SOM) | The portion of SAM that your company can realistically capture in the short to medium term, given its resources, capabilities, and competition. | Represents the realistic, near-term revenue target; your actual achievable market share. | Realistic percentage of SAM × SAM. |
Presenting all three metrics credibly demonstrates a comprehensive understanding of the market, from its vast potential to your company’s immediate, actionable goals. This nuanced approach inspires confidence in investors, proving you have a clear vision of the future while remaining grounded in present realities.
Common Mistakes in TAM Calculation (And How to Avoid Them)
Many startups, eager to impress, fall into common traps when calculating their TAM. These missteps often lead to inflated, unrealistic projections that can instantly raise red flags for discerning investors, eroding trust and leading to critical internal miscalculations.

- The “Top-Down” Trap: This is perhaps the most frequent error. Startups often declare, “It’s a huge market, and if we just get 1% of it, we’ll be enormous!” This simplistic, top-down approach lacks underlying assumptions and rarely holds up to scrutiny, signaling a lack of due diligence. Solution: Always build your market size estimate meticulously from specific components using a bottom-up approach.
- Confusing “Size of the Problem” with TAM: Just because a problem is massive doesn’t mean your solution can capture all the associated revenue. For instance, stating “the opioid crisis is a $100 billion problem” is about the problem’s scale, not your product’s revenue potential within it. Your TAM must be directly tied to the market opportunity your solution creates, otherwise, you risk misallocating resources. Solution: Directly tie your TAM to the market opportunity your specific solution creates, not the problem’s overall cost.
- Claiming the Entire Market: You might be in the cybersecurity industry, but your niche cybersecurity product isn’t going to serve every single company in the $250 billion global cybersecurity market. Your TAM needs to reflect your specific market, the segment that your product truly addresses, not the industry’s behemoth total. Overstating your market leads to unfocused strategies. Solution: Define your specific market segment that your product truly addresses, reflecting your niche.
- Inaccurate or Unvalidated Pricing: Your TAM is calculated as “Number of Customers × Your Price.” If the price you’re using is hypothetical, or worse, borrowed from a high-charging competitor when you plan to be a low-cost alternative, your entire calculation will be fundamentally flawed. This can lead to unrealistic revenue projections and poor strategic decisions. Solution: Base your TAM on your actual or rigorously tested pricing, reflecting customer Willingness to Pay (WTP).
- Lack of Documented Assumptions and Data Sources: This is where transparency comes in. Investors aren’t looking for magic; they’re looking for logic. Failure to show your work, detailing where your customer numbers come from and how your pricing is validated, instantly erodes credibility and suggests a superficial understanding of your market. Solution: Clearly document every assumption, data source, and step of your calculation to build credibility.
- Unrealistic Customer Targeting and Geography: A broad, undifferentiated customer base like “all companies globally” leads to an inflated TAM. You need to precisely define your ideal customer profile and the geographic regions you genuinely plan to serve. This lack of focus can lead to wasted marketing and sales efforts. Solution: Precisely define your ideal customer profile and the realistic geographic regions you plan to serve.
| Common Mistake | Description | How to Avoid/Correct |
| The “Top-Down” Trap | Simplistic assumption of capturing a small percentage of a huge market without underlying data. | Build your market size estimate meticulously from specific components using a bottom-up approach. |
| Confusing “Size of the Problem” with TAM | Equating the scale of a societal problem with a product’s revenue potential within it. | Directly tie your TAM to the market opportunity your specific solution creates, not the problem’s overall cost. |
| Claiming the Entire Market | Assuming your niche product serves an entire industry’s market, rather than a specific segment. | Define your specific market segment that your product truly addresses, reflecting your niche. |
| Inaccurate or Unvalidated Pricing | Using hypothetical or competitor’s pricing that doesn’t reflect your actual or rigorously tested price points. | Base your TAM on your actual or rigorously tested pricing, reflecting customer Willingness to Pay (WTP). |
| Lack of Documented Assumptions and Data Sources | Failing to provide transparency on where customer numbers come from and how pricing is validated. | Clearly document every assumption, data source, and step of your calculation to build credibility. |
| Unrealistic Customer Targeting and Geography | Defining a broad, undifferentiated customer base (e.g., “all companies globally”) leading to inflated numbers. | Precisely define your ideal customer profile and the realistic geographic regions you plan to serve. |
How to Calculate TAM the Right Way: The Bottom-Up Approach
The only credible way to calculate TAM is through a bottom-up approach. This involves building your market size estimate from specific, well-defined components. This method is not just about arriving at a number; it serves as a proxy for your overall market understanding and operational discipline. Investors, in particular, use this calculation as a diagnostic tool, scrutinizing the underlying assumptions and data integrity to grasp your team’s due diligence, understanding of the ideal customer, and commitment to transparency. The rigor of this approach compels critical market research and customer validation early in your journey, leading to a more accurate product-market fit and a robust overall business strategy.
The fundamental formula is straightforward:
TAM = Number of Target Customers × Your Price (per customer or unit)
Here’s how to break down the process:
- Define Your Target Customers with Precision
Specificity is Key: Avoid vague terms like “all companies” or “everyone.” Instead, think about the precise characteristics of your ideal customer. Are they small-to-mid-size businesses? Fortune 500 enterprises? Early-stage startups? Specific demographics like Gen Z gamers or senior citizens?
Narrow the Scope: Identify the precise industry, business size, or user behavior that defines your core customer base.
Specify Geography: Are you targeting the US market? North America? A specific city? Or truly global? Be realistic about your current and immediate future reach.
Cite Your Data: Crucially, document where you found the numbers for your customer base. Reliable sources could include industry reports, government statistics, market research firms, or even your own primary research. - Determine Your Price with Accuracy
Use Your Actual/Tested Pricing: If you’re an early-stage startup, you must have rigorously tested your pricing with potential customers to validate their Willingness to Pay (WTP). For established businesses, use your proven price points.
Define the Unit of Measure: What does your price apply to? Per month? Per user? Per branch? Per device? Per transaction? Be explicit.
Your Price, Not Competitors’: Your TAM must reflect your revenue potential. If your pricing strategy differs significantly from competitors, use your own projected price, not theirs. - Show Your Work
Document Everything: Every assumption, every data source, and every step of your calculation must be clearly documented. For presentations, using footnotes on your slides is highly recommended. This transparency builds trust and demonstrates a thorough understanding of your market.
This rigorous, bottom-up methodology is vital. Why? Because multiplying two numbers that are based on inaccurate assumptions (e.g., an inflated customer count and a speculative price) will inevitably result in an unrealistic TAM. This process of “narrowing the TAM funnel” ensures your calculation is grounded in reality.

With this approach TAM, SAM, and SOM become very correlated with TAM been the first to be calculated. SAM and SOM are a consequence of the first (TAM).
Example: Right-Sizing the Cybersecurity Market
Let’s illustrate the bottom-up approach with a common scenario: a cybersecurity solution.
The Initial (Mistaken) Approach:
A common misstep is for a company to proudly announce, “Our ‘Swiss Army knife’ cybersecurity product crushes nearly every problem a company has! The cybersecurity market is a trillion-dollar global problem, and the market size is $250 billion annually!”
This is a classic top-down, problem-focused, and overly broad estimate: a significant red flag for any seasoned investor or strategic planner. It lacks specificity and fails to demonstrate a true understanding of where the company fits within that vast market.
The Correct (Bottom-Up) Calculation Process:
This process involves a rigorous “funneling” of the market, moving from a broad concept to a highly specific, addressable segment.
1. Narrowing the Customers:
- Initial claim: “Every company globally” (e.g., hundreds of millions of potential customers).
- Drill down: “Not every company, but primarily financial institutions.” (This might narrow it to, say, hundreds of thousands of institutions worldwide).
- Further refinement: “Not all financial institutions (e.g., not large insurance, credit card, or mortgage companies), but rather solutions fine-tuned for bank-specific cybersecurity issues.” (This could reduce the target to tens of thousands of banks).
- Even deeper: “Not massive global banks (like JP Morgan, Citibank), but specifically small to mid-size banks that don’t have a dedicated Chief Information Security Officer (CISO) and rely on a VP of IT or CIO for security.” This is where their value proposition truly shines, potentially narrowing the focus to thousands of such institutions.
- Geographic scope: “We currently operate and support customers in North America, South America, and Europe. Asia and Africa would be future expansion opportunities.” This further refines the number of target institutions to a specific, manageable count (e.g., ‘X’ thousand relevant bank branches in the defined regions).
Resulting Target Customer: Small to mid-size bank branches in North America, South America, and Europe without a dedicated CISO. The next step is to accurately quantify the number of such branches.
2. Determining the Price:
- Initial claim: “Around $10,000.”
- Drill down: “$10,000 per what unit?”
- Clarification: “$10,000 per branch per month.” (This price must be rigorously tested and validated with potential customers).
3. Calculating TAM:
Once the specific number of target customer units (e.g., “X” number of relevant bank branches in the defined regions) is identified, and the validated price ($10,000 per branch per month) is established, the TAM can be calculated:
TAM = (Number of relevant bank branches) × ($10,000/branch/month) × (12 months/year)
By undergoing this rigorous narrowing process, the initial, grandiose “$250 billion market” often transforms into a more realistic, yet still substantial, “$250 million a year” market. This provides a much more accurate and credible TAM, showcasing a grounded understanding of the market.
The Strategic Advantage of Right-Sizing Your Market
For many, seeing a massive market shrink to a more realistic figure can feel like a reduction in ambition. However, this “right-sizing” is, in fact, a profound strategic advantage. A smaller, precisely defined market allows for:
- Hyper-focused Product Development: You can tailor your solution to the exact needs of a specific customer segment, achieving a stronger product-market fit.
- Targeted Marketing & Sales: Your marketing budget and sales efforts become far more efficient, reaching the right customers with the right message, leading to higher conversion rates.
- Optimized Resource Allocation: Precious early-stage resources (time, money, talent) are not wasted chasing an impossibly broad market.
- Investor Confidence: Investors often prefer a credible, focused plan for a well-understood, albeit smaller, market over a vague, inflated claim for a massive one. A realistic TAM, and subsequently a realistic SOM, demonstrates a clear, executable path to market dominance within a specific niche. This “land and expand” strategy is frequently more appealing and less risky than attempting to capture a tiny percentage of an impossibly large market, signaling a mature and disciplined approach to growth.
Beyond TAM: Introducing SAM and SOM
While TAM paints the big picture, it’s just the starting point. To provide an even clearer and more actionable view of your market opportunity, you need to consider Serviceable Addressable Market (SAM) and Serviceable Obtainable Market (SOM). These two metrics offer increasingly realistic perspectives on the portion of the market you can genuinely target and capture. The video below illustrate how to calculate TAM and I used it as a key reference for this part of the post:
Final note on Mastering TAM, SAM, and SOM
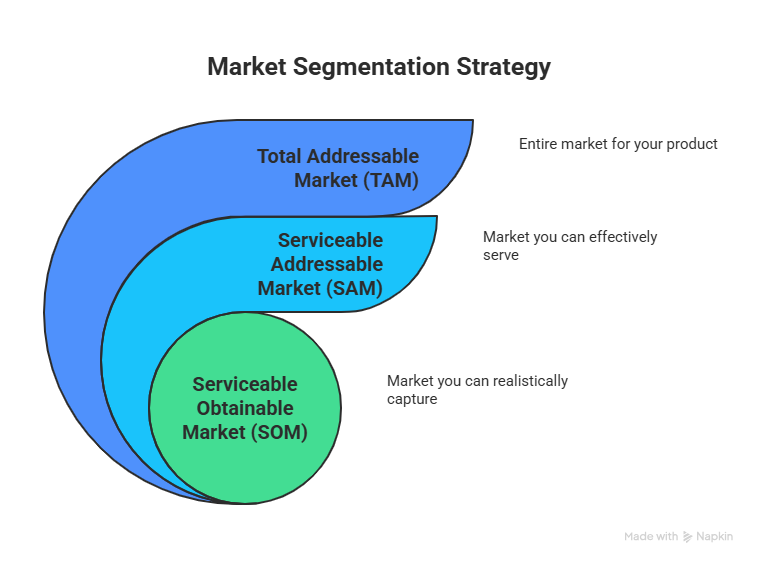
Think of these three market sizing metrics as concentric circles, each offering a progressively narrower and more realistic view of your market opportunity. In short TAM, SAM, and SOM are:
TAM (Total Addressable Market): The outermost and largest circle. This is the entire ocean, the theoretical maximum revenue if you captured 100% of the entire market globally, without any competition. It sets the ceiling and signals the overall market potential.
SAM (Serviceable Addressable Market): A smaller circle within TAM. This represents the portion of the ocean you can actually reach with your current fishing boat and equipment (your business model, product, and distribution). It defines the segment you are capable of serving.
SOM (Serviceable Obtainable Market): The innermost and smallest circle within SAM. This is the number of fish you can realistically expect to catch given your current crew, bait, and competition. It’s your realistic, near-term revenue target.
Presenting all three metrics (TAM, SAM and SOM) credibly demonstrates a comprehensive understanding of the market, from its vast potential to your company’s immediate, actionable goals. This nuanced approach inspires confidence in investors, proving you have a clear vision of the future while remaining grounded in present realities.
In conclusion, mastering TAM, SAM, and SOM is not merely an academic exercise but a fundamental discipline for anyone seeking to understand and capitalize on market opportunities. By diligently applying these metrics, you gain unparalleled strategic clarity, optimize your resource allocation, and build a robust foundation for sustainable growth. Embrace the rigor of accurate market sizing, and you will not only articulate your vision with greater precision but also navigate the complexities of the market with confidence, transforming potential into tangible success.
Help me share this post:
Beyond the Hype: Mastering #TAM, #SAM, and #SOM Share on XDon't let inflated market projections sink your venture. Get grounded in reality with #TAM, #SAM, and #SOM. It's about building a viable business, not just chasing #hype ! #MarketSizing #BusinessStrategy #StartupTips #MarketAnalysis… Share on XThanks for taking the time to read this blog post on TAM, SAM and SOM. Other related posts includes: